Claylands - hedges (credit: Matt Jones)
Connectivity mapping
Ecological connectivity is the ability of wildlife to move freely across the landscape to find food, a mate, good breeding territory, and establish new homes.
Free movement relies on different areas of suitable habitat being connected so that species can safely travel between them. If these habitats become fragmented – for example, by roads or motorways – it stops wildlife from accessing the resources they need to survive.
As we work to protect Norfolk’s incredible wildlife on a landscape scale, ecological connectivity becomes a key concept. To restore a resilient and wildlife-rich countryside, we must link together our remaining fragments of habitat.

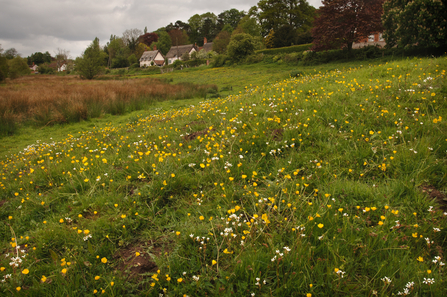
Claylands landscape (credit: M. Watson)
Through our Claylands Wilder Connections project, we worked with the GeoData Unit at Southampton University to map ecological connectivity across Norfolk using a range of existing habitat data.
The process:
In a nutshell, our connectivity maps have been developed as follows:
-
The core sites in the ecological network are identified. These are the nature-rich locations we aim to link. For the main connectivity map, the core sites are the SSSIs (Sites of Special Scientific Interest) and County Wildlife Sites – our havens of biodiversity from which the wider countryside can be recolonised.
-
All other habitats across the county are scored. The scoring allocated to each habitat reflects how likely it is to support a range of wildlife, and therefore how conducive it might be to species moving through the landscape. Areas of species-rich grassland and scrub score more highly than arable fields.
-
The above data is then brought together and analysed using digital mapping tools.
The outputs:
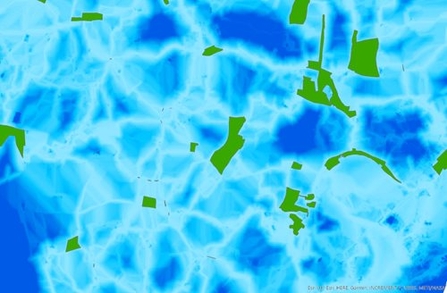
The main output of the process is a ‘heat map’ of connectivity, indicating how well-connected habitats are in different parts of the county. This is a valuable tool for decision-making and effective conservation action, whether reinforcing existing corridors or targeting the gaps currently barring species movement.

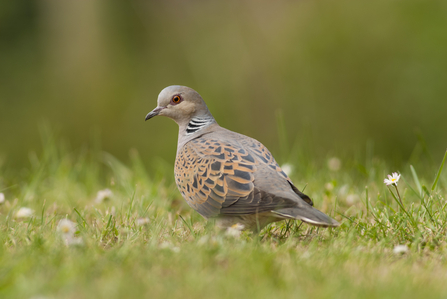
Turtle dove (credit: Dawn Monrose)
Connectivity mapping can be adapted to create maps showing where certain species are more likely to prosper
Alongside the general habitat connectivity map, the team has produced experimental connectivity maps for individual species. Based on the same underlying data, core sites reflect where species currently occur, with the habitat scoring tweaked to reflect the specific requirements of the individual species.

Connectivity mapping (credit: NWT)
Newly developed connectivity heat mapping shows how easy, or difficult, it is for species to move between areas of core habitat. Darker blue areas show habitats that are a challenge for species to cross, with pale blue areas being easier to cross. Green polygons show important areas of core wildlife habitat such as designated wildlife sites.
Using the connectivity maps
Our aspiration is for the connectivity maps to be made available to everyone via the Norfolk County Council GIS webpage. These maps are currently under development as part of the Local Nature Recovery Strategy process and we hope they will be publicly available soon.
